How Maths — No Problem! sets the stage for learning statistics
Understanding how to gather and use data is becoming an increasingly necessary skill. See how Maths — No Problem! introduces statistics from the start, and builds learners’ skills all throughout the primary years.
Now more than ever, we rely on the information and trends at our fingertips that help us make decisions.
But having data right in front of you won’t help if you don’t know how to use it properly. Teaching learners how to gather and make sense of information is what helps them understand the world around them.
That’s why Maths — No Problem! lessons are based on Bruner’s spiral curriculum model. Every lesson is a continuation of previous learning and core skills are continuously revisited at higher levels.
Take statistics for example. Children are introduced to statistics in Year 1 and they continue to build on their learning as they move up through the primary years until they can read and interpret data sets with confidence.
Year 1: building learners’ foundations in statistics
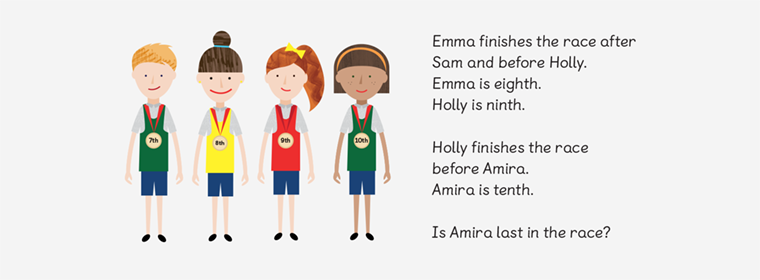
Year 1 sets the stage for all learning to come, so at ages 5–6, children focus primarily on the positional language used when gathering statistics.
Maths — No Problem! lessons start to build learners’ familiarity with naming positions and ordinal numbers like first, second and third.

By learning how to order and express information, children develop a base for how to talk about and understand data in more complex applications later on.
Year 2: expanding skills in data presentation and interpretation
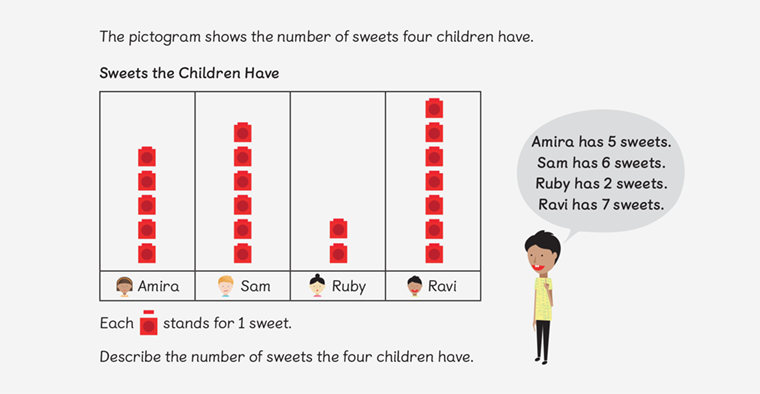
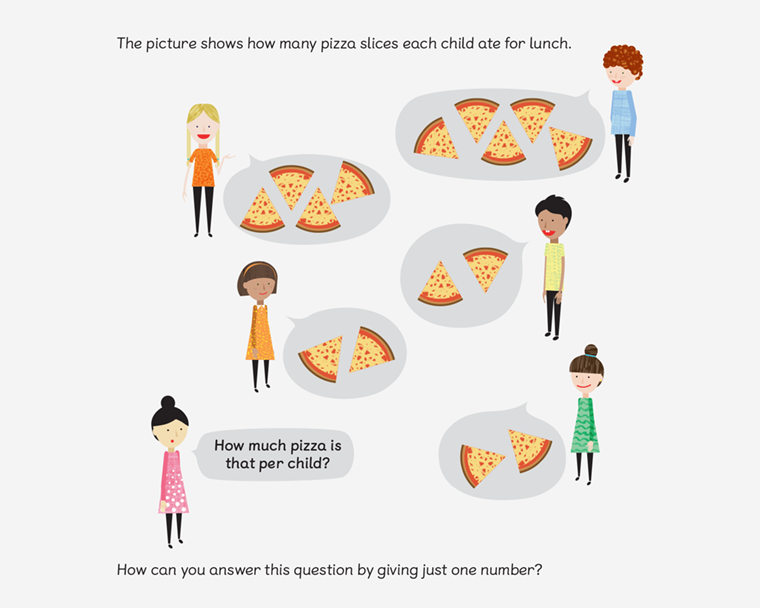
Now that learners know how to understand and express data, they’re ready to start developing their skills in reading, interpreting, analysing and constructing graphs.
Building on their foundations from Year 1, children in Year 2 begin learning how to read and interpret picture graphs.

As learners progress through each primary year, they’ll tackle new and more complex concepts, revisit subjects and continue solidifying their understanding and skills.
Transform Your Maths Assessment
Insights — our online assessment tool — gives you instant, powerful data to identify gaps and improve results.

Year 6: exploring averages and calculating the mean
Once children are able to read and interpret data sets with confidence, they’re ready to move on to handling those data sets using averages.
In Year 6, learners start by exploring the different types of averages, calculating the mean and using the mean to determine other information.

Using averages as an indicator is a skill we use constantly to make predictions and decisions. With an understanding of averages, children will be more prepared to make informed decisions in their own lives.
Learning how to find, interpret and use information to solve problems is a valuable skill — one we use daily. But for children growing up with an enormous amount of information available to them, knowing how to handle and understand that data is more important than ever.
By learning statistics and data analysis, children will be more prepared to make the best decisions they can throughout their lives.
